Stocks’ Climb Is Challenged During Volatile First Half1
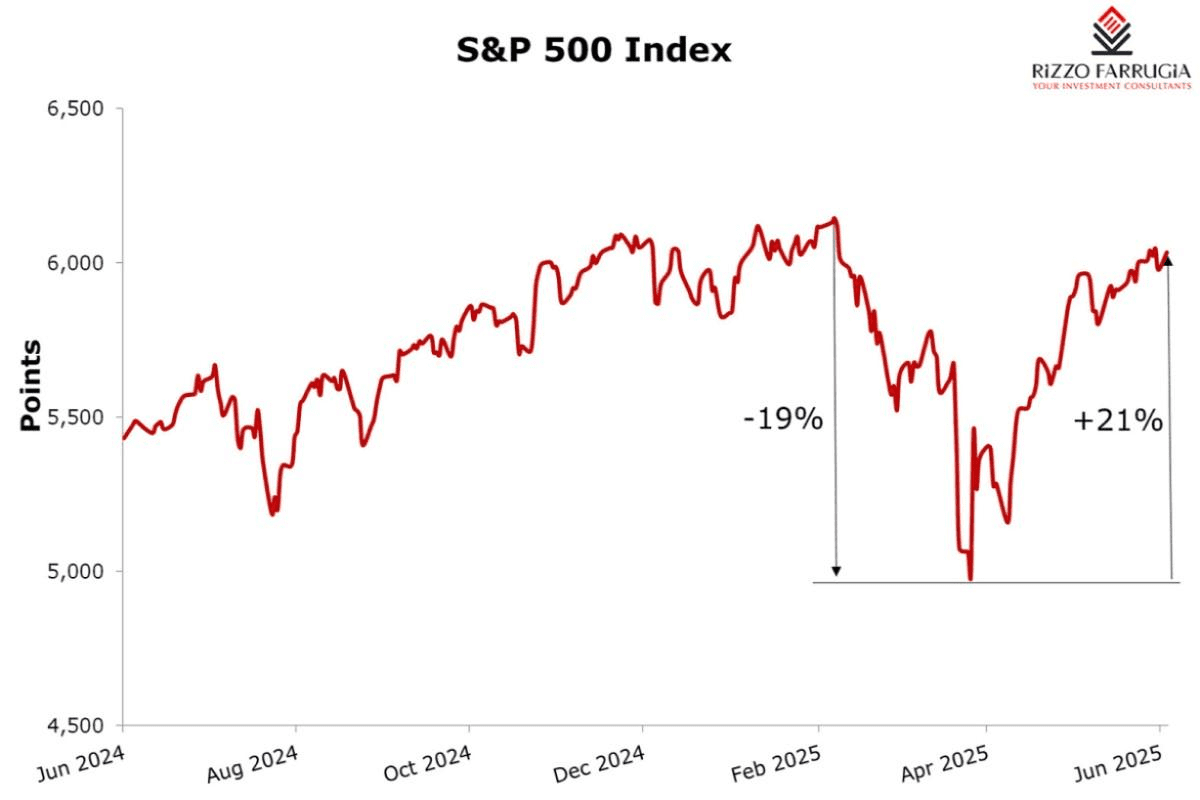
Markets took investors on an up-and-down ride during a volatile first half of the year, with notable swings coming amid uncertainty about the impact of tariffs on the US and the global economy.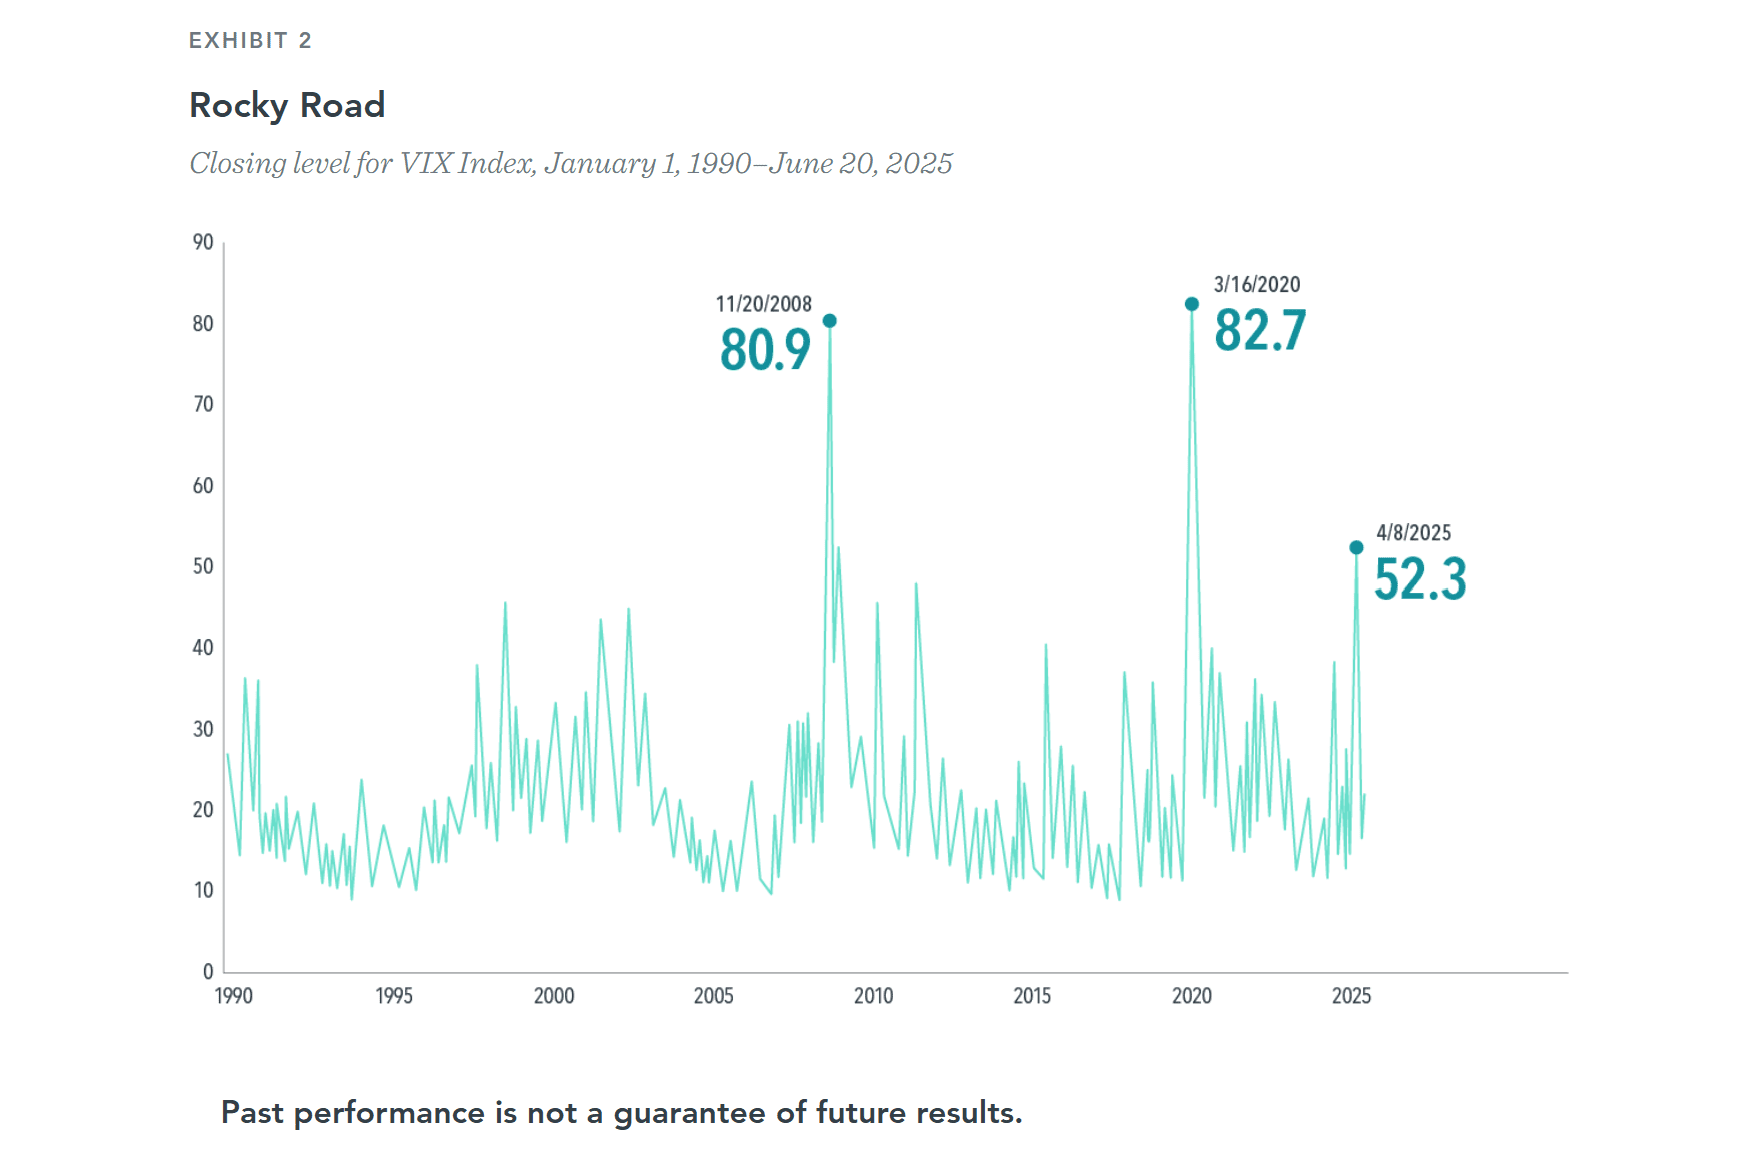 In the US, while the S&P 500 hit new highs in February, it also posted sharp falls in April, before rebounding in May to end slightly higher as of June 20.2 In a reversal of trends in recent years, developed international equity markets outpaced the US, as did emerging markets. The US Federal Reserve held interest rates steady, citing risks of higher inflation and a rise in unemployment. In the bond market, US Treasuries were higher, with the benchmark 10-year yield just below 4.3%.3
The Fed kept the federal-funds rate unchanged in the 4.25%–4.5% range in May and June, but officials warned that uncertainty about the economic outlook remained elevated.4 On inflation, the US core consumer price index, which excludes more-volatile food and energy items, showed prices rose 2.8% from a year earlier in May, the most recent data available—higher than the Fed’s target rate of 2%.5
Approaching the year’s halfway point, the S&P 500 Index was up 2.1% and the tech-heavy Nasdaq was ahead 1.0%. Both indices at one point in April had fallen 20% from their previous highs. Global equities, as measured by the MSCI All Country World Index, rose 6.2% as of June 20, even amid conflict in the Mideast that escalated in mid-June. Developed international stocks rose 15.5%, as measured by the MSCI World ex USA Index. The MSCI Emerging Markets Index gained 12.0.%.6 The outperformance of international markets is further evidence of the benefits of global diversification. Holding equities from markets around the world, as as opposed to those of a few countries or just one, positions investors to potentially capture higher returns wherever they may appear.
 With the return of significant volatility in the first half of 2025, the S&P 500 moved at least 2 full percentage points on eight separate days in April. Market volatility may be unnerving, but it is also a sign of a working market. Whether responding to economic forecasts, consumer price changes, or tariff policy updates, market prices adapt to new information. It would be surprising if markets didn’t have reactions that are reflective of impactful events. So while the news headlines may be concerning, market turbulence historically has subsided, giving investors good reason to resist making changes. Pain one may feel now reflects markets setting prices such that expected returns are always positive. So when the market experiences a sudden drop, remaining committed to a plan can help investors avoid day-to-day worries, and set them up for the long-term rewards that the market can offer.
To your success,
The Avion Wealth Team
For educational purposes only. Consult your financial advisor.
Sources
1 Dimensional. Midyear Review: Stocks’ Climb Is Challenged During Volatile First Half. June 26, 2025
2 S&P data © 2025 S&P Dow Jones Indices LLC, a division of S&P Global. All rights reserved. Data as of June 20. Indices are not
available for direct investment. Their performance does not reflect the expenses associated with the management of an actual
portfolio.
3 Returns are based on the Bloomberg US Treasury Bond Index as of June 20. Bloomberg data is provided by Bloomberg Finance
LP. Source for US Treasuries: US Department of the Treasury.
4 The federal-funds rate is the overnight interest rate at which one depository institution (like a bank) lends to another
institution some of its funds that are held at the Federal Reserve. Source: “Federal Reserve Issues FOMC Statement,” Federal
Reserve, June 18, 2025.
5 Inflation data is as defined by the consumer price index (CPI) from the US Bureau of Labor Statistics; the core CPI is an
aggregate of prices paid by urban consumers for a typical basket of goods, excluding food and energy; Lucia Mutikani, “US
Consumer Prices Rise Moderately; Tariffs Seen Fanning Inflation,” Reuters, June 11, 2025.
6 MSCI data © MSCI 2025, all rights reserved. Data as of June 20. Indices are not available for direct investment. Their
performance does not reflect the expenses associated with the management of an actual portfolio.