Here’s an exercise you may find informative. Ask a couple friends what happened to the stock market in 2020. You’ll get a wide array of answers, but here’s an answer you’re unlikely to receive: “The S&P 500 rose 16.26% in 2020, an above average annual return and a good year of market performance by any standard.” Why shouldn’t we expect this answer? It likely has something to do with the sharp pandemic-induced 34% drop we saw at the beginning of 2020, which comes to mind quicker than the gains the index posted by the end of the year.
Unfortunately, as human beings, our brains aren’t hardwired for good investing. Studies show that human beings find a 1% loss to be more painful than a 1% gain is enjoyable – this leads us to focus on potential losses (because they have a greater emotional impact on the human mind) more than we focus on potential gains. As the fathers of behavioral economics – Khaneman and Tversky – would put it, the human mind is prone to “myopic loss aversion.” In their paper on the subject, they note that their experiments led them to define myopic loss aversion as “the combination of a greater sensitivity to losses than to gains and a tendency to evaluate outcomes frequently.”
So why is myopic loss aversion so important to be aware of at this juncture?
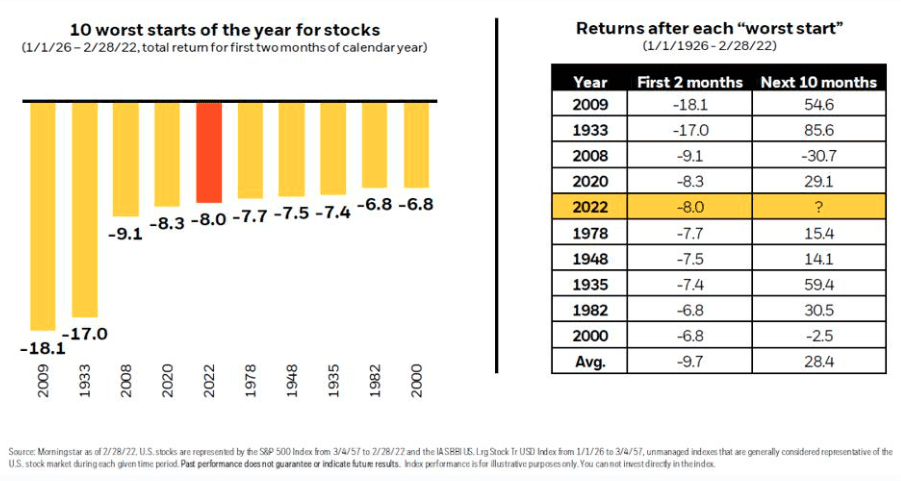
When we take a look back at the how the market started the year, we’ve witnessed one of the worst starts to a year (as defined by performance in the first two months of the year) on record. It’s not a flattering statistic (more on this further down); however, focusing on the unpleasant losses markets have experienced recently and allowing performance over a short period of time to influence future investment decision making makes us prone to another way our mind tries to trick us when it comes to investing – recency bias.
Recency bias is the tendency to place too much emphasis on experiences that are freshest in our memory. Focusing on recent volatility and not the data that shows fundamentals underpinning the markets are strong could prevent us from capitalizing on the improved risk-adjusted opportunity in the markets. Historically, market setbacks like this – whether they be caused by war, heightened geopolitical risk, interest rate risk or inflation fears – have proven temporary. While headlines at this juncture can create cause for concern, there are still plenty of reasons to be bullish.
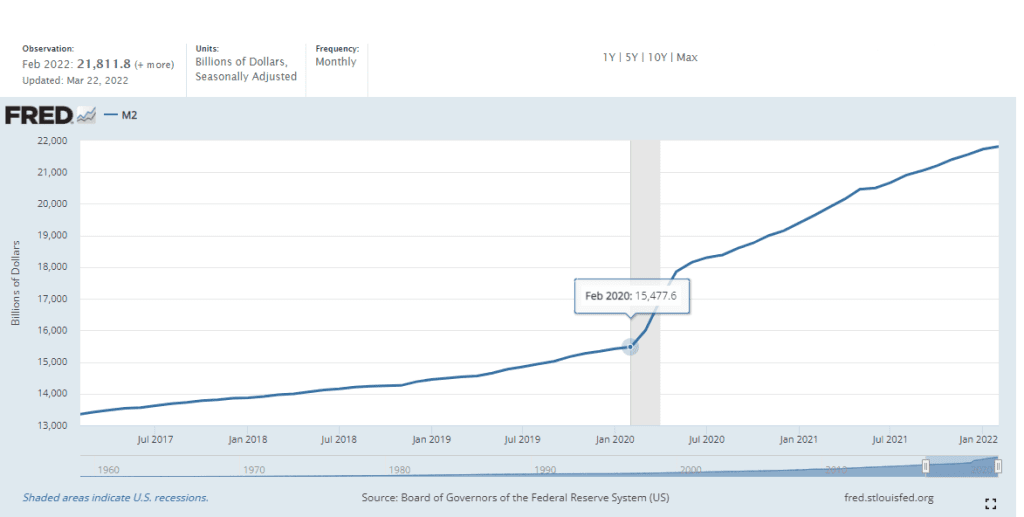
- The US dollar money supply has increased by over 41% in the past two years. Pre-Covid, the average rolling two year increase in the money supply (going back to 1961) was 14%. The increase we have seen in the US dollar money supply since February of 2020 is 2.9x greater than the average increase over historical 2-year rolling periods.
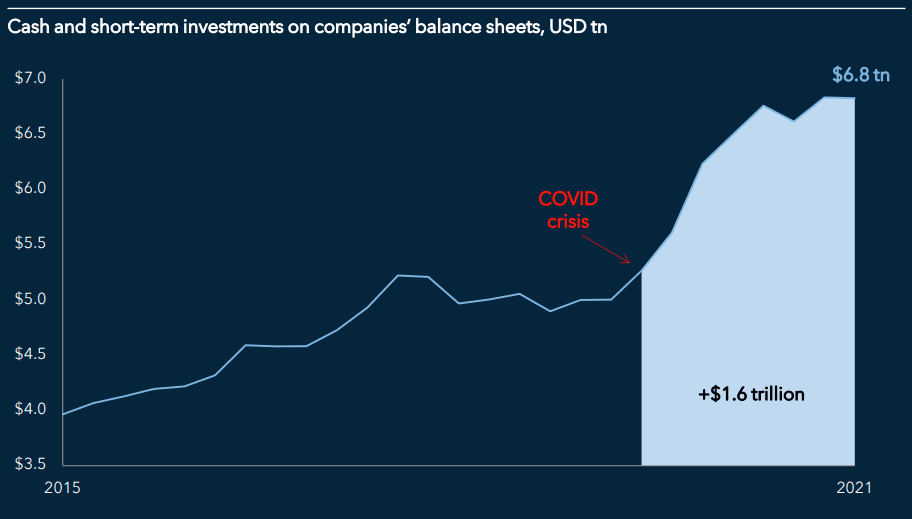
- Corporations entered this year with very liquid balance sheets. With so much cash and cash-equivalents on hand, corporations must put this cash to work soon if they wish to avoid an erosion of purchasing power due to inflation – which is currently running at a 40 year high of 8.5%.
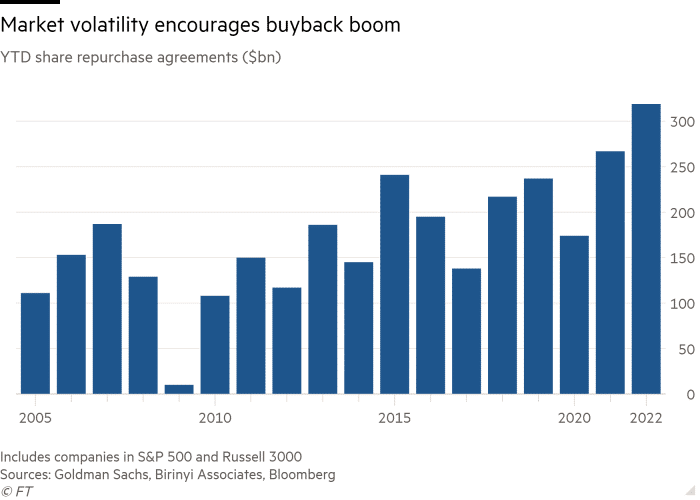
- As corporations look to put cash to work to prevent further purchasing power erosion due to inflation, a record $319B of stock buybacks have been approved this year, providing a strong source of demand for equities.
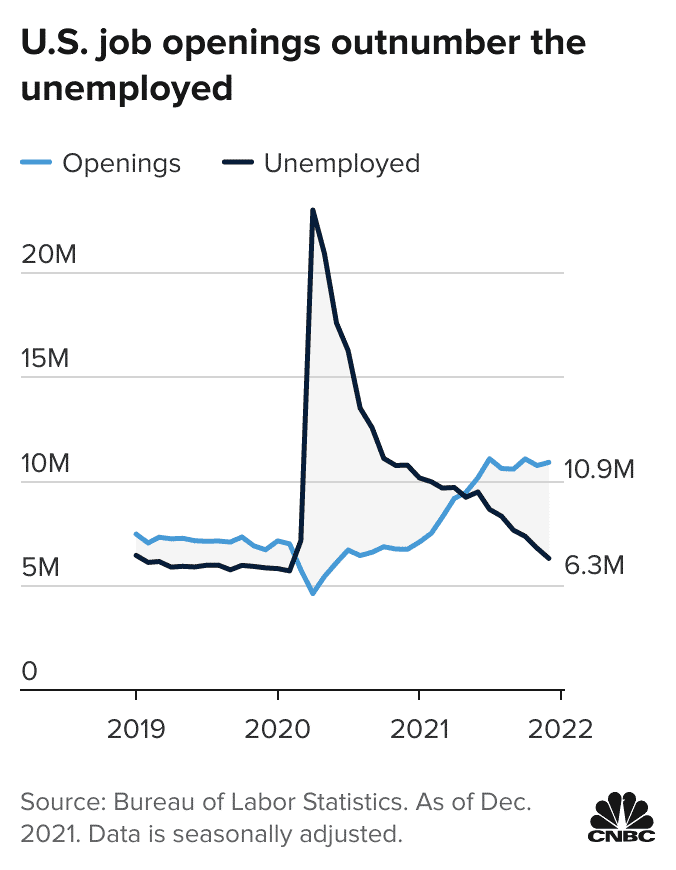
- While inflation is putting pressure on the consumer, there is a record amount of job openings in the US relative to unemployed workers, meaning demand for labor significantly outpaces current labor supply. This paints a good picture for wage increases in the medium-term as companies look to fill openings. Higher wages will help consumers keep better pace with inflation.
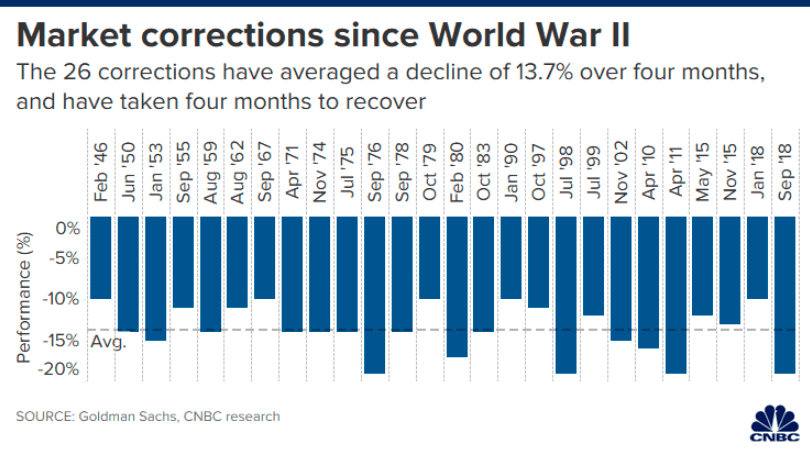
- A combination of strong fundamentals and dour sentiment increases the likelihood that this period of volatility is a correction and not the beginning of a new bear market. It seems difficult to believe that with so much cash on the sidelines this bull market that started in March 2020 would be one of the shortest bull markets in history (defined as less than 31 months). This correction in the S&P 500 started on 1/3/22. Historically, corrections have been sentiment driven drops that average a decline of 13.7% over four months and take four months to recover.
- Lastly, although a bad start to the year may be painful, beware of recency bias’s potential to influence your investment decision making heading into the rest of the year. A bad start to the year has historically been a good omen for stocks heading into the end of the year, with equities averaging a return of 28.4% in the ten months after the ten worst starts to a year on record (going back to 1926).
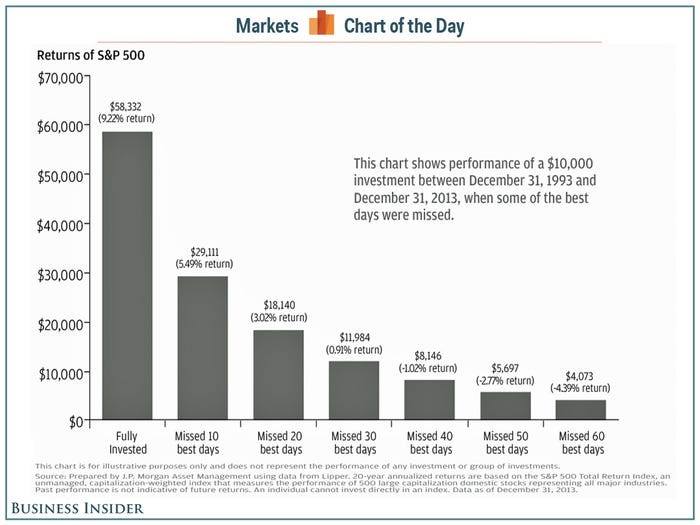
While we may not be out of the woods just yet and volatility could certainly continue, what we do know is that when markets come back, they can come back very quickly. While many investors beset by myopic loss aversion and recency bias may be hesitant to invest at this current juncture fearing further volatility, data shows that long-term investors should be more concerned about missing out on a quick comeback. Missing just a handful of the best days in the market can be extremely detrimental to a long-term investor’s returns, as shown in the chart below.
If you have questions on your current investment strategy or would like to create a strategy to take advantage of current market volatility, please do not hesitate to reach our team via phone or e-mail and we’d be happy to help.
Respectfully,
Paul J. Carroll
Special thanks to my friend Sanjeev Sardana for allowing me to repurpose content.